Second day of the annual SABR convention! My day started very bright and early.
Today’s items included:
Women in Baseball Committee Meeting
Annual Business Meeting
Library of Congress Presentation
21* — on Tom Cheney, the pitcher who struck out 21 in one 16 inning game
Walter Johnson vs. Babe Ruth
On-Base Improvement by Veterans
Christina Kahrl of Baseball Prospectus
Bullpen Evolution, 1960-2008
Does Running Bases Harm Pitching Performance?
Effect of Defensive Positioning on Offensive Performance
Women & Baseball Committee Meeting
Over 35 people were at this 8am meeting, the very first meeting of the convention. However, totally worth the early hour, and not just because Dorothy Seymour Mills brought free cookies from the woman-owned Cooperstown Cookie Company and Claudia Perry brought door prizes (women’s BB t-shirts from the Hall of Fame).
Members gave reports on what they are up to. Merrie Fiedler isn’t here but she sent a report about the Cooperstown Symposium, an annual baseball research weekend held in guess where. She said that women’s participation in the conference is growing. 12 women gave presentations and about 30 attended actively. More and more woman are discovering that writing and researching baseball is one way to get connected to the game when they were shut out of playing or being on the field.
Leslie Heaphy, committee co-chair, pointed out that anyone who comes across any mention of women in baseball in the news, whether in current news stuff or whether in microfilm research or looking into archives, to send the links or a copy of the article to her. (If you have such things, email lheaphy(at)kent.edu)
She told the story of one note a SABR researcher just stumbled across while looking up something else, from a Rome, NY newspaper in 1911 about a semi-pro team that listed the team president as Lillian Duke. But apparently local lore says she was actually the manager, not just titular president and there are photos of her in uniform. There may be a fascinating story there for a researcher to dig into!
There are lots of women’s leagues out there right now, though, and if we don’t document them NOW we’ll end up 50 years from now in the same boat we are currently in with the AAGBPL where a lot of the knowledge has been lost. California, Seattle, DC, all have very active leagues (not to mention other countries), and in fact if I were not on an 11am train back to Boston on Sunday, I’d try to stay a little longer because there are two games going on here in DC.
Susan Petrone talked about the “Line Drives and Lipstick” traveling exhibit that may turn into a symposium at Ursuline College. Meanwhile right now the Betsy Ross museum has a baseball exhibit going on right now in Philadelphia, and it includes some stuff about the Philly Bobbies women’s team. The Smithsonian wants to develop a traveling exhibit, too, and are searching up artifacts.
Recent books: Jennifer Ring has a book called Stolen Bases, a political science take on how women and girls have been excluded from the game and whose daughter plays in a league (whcih is why she isn’t here at the convention, actually!), and Merrilyn Cohen’s No Girls in the Clubhouse.
Now off to the next thing!
***
Business Meeting
Next came the SABR business meeting. Out of about 600 registrants at the convention, I’d say close to 250 were at the business meeting. Given that the meeting was mostly things like going over the budget, that was a nice number to see. Also encouraging are the high number of people who are attending their first SABR convention.
SABR is solvent and, although the organization is taking a hit like everyone with the recession, in very good financial shape.
For some reason it was at the business meeting I really keenly felt the absence of the people we’ve lost since last year. A lot of people I was friendly with, some of whom I knew pretty well, have passed away, including John Pardon, Gene Carney, and just quite stunningly recently, Fred Ivor-Campbell. All I can say is wow, and you fellas are all missed.
After that, I woke up my roommate (we only slept three hours because of how early we got on the train) and then hurried down to the hotel restaurant to grab a good breakfast to last me through the day.
I decided to skip the first Research Presentation in favor of the presentation by the Library of Congress, introducing researchers to the LOC. Some wow facts out of that presentation:
-142 million items in the LOC
-21 million books (32 million total volumes, including braille versions)
-half the books are not in English
-470 languages represented
-also have audio recordings, maps, photos, microfilms, etc etc
-1.2 movies, motion pictures and tv shows
-10,000 new items come in PER DAY
-1000 new BOOKS per day
-plus nearly every doctoral dissertation in the entire US–close to 3 million of them
844 doctoral dissertations are on baseball, 151 came up with baseball stats. You can’t get that info anywhere else all in one place.
I don’t know if I’ll get a chance to see the Library of Congress while I’m here (any of its three buildings…) but it was neat to know about.
***
21*
I just caught the end of the Tim Herlich’s presentation on Tom Cheney, a pitcher who suddenly got it all together in 1962, but then got hurt in 1963, nipping his stardom in the bud. He pitched 228 pitches in a 16 inning game for Washington in 1962, one of only 3games in in major league history where a pitcher stayed in for 16 innings. Juan Marichal and Gaylord Perry also both did it. (Marichal’s was a shutout. Perry got no decision.) He set a record that day with 21 strikeouts in a single game, but the record apparently hasn’t been much remembered either by MLB or the public. Cheney beat the Orioles that day by a score of 2-1. The record still stands today as unbroken. Cheney’s injury came the following year when he came in after pitching the seventh to tell Gil Hodges that his elbow was throbbing. He asked out, but Hodges sent him back out to pitch the eighth, and then the ninth. It was his last complete game, and the following start he didn’t last beyond three innings and his career was essentially over. Cheney blamed Hodges, but modern thinking questions whether the wear and tear from the 16 innings, 228 pitches, didn’t start the clock ticking on his arm.
Before coming in here I took a spin through the vendor room to look at books. There’s a very nice looking 1954 treasury of Grantland Rice with a leather-embossed cover that I might need to have if someone else hasn’t bought it by the end of the weekend. And I really should buy Scott Price’s book on Mike Coolbaugh, which he is signing right now. I knew Mike very tangentially when he was a farmhand in the Yankees system. For those who can’t remember why that name is familiar, he’s the minor league coach who was killed by a foul ball, and the reason (as far as I know) why all major league base coaches now all wear helmets.
* * *
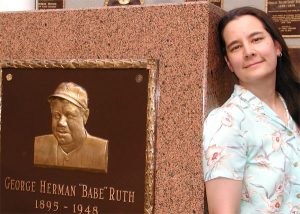
Walter Johnson vs. Babe Ruth
Next, Eric Weiss’s head to head comparison of Babe Ruth and Walter Johnson. Weiss opened by saying that “some people consider Ruth the greatest hitter of all time” which was met with nods, and “some people consider Walter Johnson the greatest pitcher of all time,” which drew enthusiastic applause from some Washington partisans in the audience.
Ruth served as a pinch hitter in his early years, including facing Johnson and Grover Cleveland Alexander. Ruth hit pretty well off Johnson. Later they had a 13-inning complete game facing each other, which Ruth won, 1-0.
Weiss showed another box score in which Ruth was the starting pitcher and batted cleanup, went 5 for 5, but lost the game 4-3. “You can’t do everything I guess.”
As starting pitchers facing each other:
8 games total, 1 in 1915, 5 in 1915, 2 in 1917
Ruth won 6 of the games, lost one, and one no decision in an extra inning game. Ruth won all three 1-0 games.
74 2/3 innings pitched, 11 ER, 1.33 ERA
Johnson won twice.
71 2/3 innings pitched, 12 ER, 1.63 ERA
Ruth hit 10 homers off Johnson in his career. Johnson only gave up 97 total homers in his career! Ruth had more than 10%! In fact, Johnson only gave up two homers in 1918 and 1919, and both were Ruth’s. No one else hit more than 5 homers off Johnson lifetime.
Griffith Stadium was a very deep outfield, very pitcher friendly, and Johnson gave up only 26 homers that weren’t inside-the-parkers, and 6 of them were Ruth’s.
1927, the day Ruth hit his 60th homer, the Yankees played the Senators and Johnson actually pinch hit in the game. Johnson hit 24 homers in his career himself, of which 19 came on the road.
Total career Ruth hit .328 off Johnson (.342 career, but with the small sample size, was only about 2 hits shy of matching career avg). He hit .355 off Johnson after 1919 when he became a non-pitcher.
Slugging Avg .686 off Johnson, career .690
OBP .449. career .474
However Ruth never homered off Johnson at Yankee Stadium. Well, not really.
In 1942, after both men were long retired, both men got in uniform again for a benefit for war bonds in Yankee Stadium. Weiss showed a newsreel of them facing off which was quite amusing. Ruth is well into his 40s here, as fat and grinning as a Buddha. He is not in good form, spinning all the way around when he swings and misses, then hitting one foul, then finally really connecting on one that actually went just foul deep in the seats, but Ruth circled the bases anyway to grand cheers. And Weiss was then cheered, too.
God, I love this game.
By the way, if you’re looking for a conclusion as to who was better, Ruth not only was still a great hitter off Johnson, he out-pitched him. While Ruth hit near his career average against Johnson, although Johnson was a good hitter career-wise, hitting .268 in the 1920s as a whole, he was only 4 for 27 with one double (.148) off Ruth.
***
Frank Howard in 1969: Can old veterans learn new tricks?
Dramatic improvements in on-base percentage among veterans.
by Steve Walker
www.stephenwalker.com
Steve played a recording of an interview he did with Frank Howard. Howard credited Ted Williams with getting him to start taking pitches. “Can you take a strike?” Ted challenged him in a conversation they had in spring training. And Hondo found himself getting in better hitters counts and walking more.
Were there other hitters who had dramatic increases later in their career? Researchers looked for those who had:
500 plate appearances
7 seasons
and were over 31 years old
Top Six:
1.Tris Speaker
In 1920 he improved by 8.8 % over his previous sesason.
2. Barry Bonds
2004 went to .609 OBP, 8.03% increase
3. Joe “Ducky” Medwick
1944 .386, 8% increase
4. George McQuinn
7.8% increase in 1947 to .395
5. Mark McGwire
1998 went to .470 by 7.7% increase
6. Luke Appling
1943 .419 OBP, increased 7.7%
Some of these though were recoveries from slumps. Where does Frank fall on this list? He is 20th all time, about a 4.5% increase.
How does the “leap” year compare to their career high improvement?
Bonds is #1 with 2002 and 2001, and Howard’s 1969 comes in 3rd, and Dixie Walker in 1944.
Interesting to see most of the ones on the list are either steroid era, War era, or 1969, which had the expansion and the change in the stroke zone. McCovey also had a big jump in ’69 but was considered too young for this study.
How did Howard do in OBP month to month in 1969?
He began at .354, above his norm, then .379 in May, .394 in June, and in July reached .500. In August he drops to .400. Then tailed off in Sept when had sore elbow.
Going back in 1968, he had only 11 more hits, but the walks made the difference. 121 versus 66. Runs went up from 79 to 111. Helped by better hitters after him, but helped a lot on base.
***
Christina Kahrl’s Featured Speaker Talk
Kahrl spoke about the history of Baseball Prospectus and the pursuit of knowledge. Only at SABR could you hear a presentation that quotes E. O. Wilson and references both the Treaty of Westphalia and VORP.
The five founders of Baseball Prospectus met via rec.arts.baseball on Usenet, and had never met each other in person when they launched the BP website and published the 1996 book. Kahrl called the book “awful,” looking back at it now. Among its errors… one team is missing… ahem. The second one was so much better, and the web was really starting to take off at that time.
Earl Weaver said he didn’t really do anything different from Casey Stengel, except pre-expansion Casey only had to really remember 3-4 competitive teams, and only half of their lineups. As information exploded, the need for changing in the way Weaver tracked organization was necessary. And sabermetrics exploded in the wake of the growing mass of information. Tony LaRussa introducing a computer to the dugout was a necessary reaction to the growth of information.
“Asking the right question is more important than finding the right answer,” Wilson wrote in his book CONCILIANCE on the nature of knowledge and its pursuit. Kahrl emphasised that even if, like her, you have no faith that we will someday discover a Superstat which would allow us to be able to finally level the playing field to be able to measure the value of any player in any era in any league, the very pursuit of such a stat is what builds the entire web of knowledge, the entire “seamless web of cause and effect” that Wilson describes as the ideal “Knowledge.”
Is the next frontier rushing at us with the new explosion of data we have with the Pitch FX and other FX data we get now from MLBAM?
When will be able to build up a worldwide database of plays that covers international leagues and minor leagues? How can a superstat ever be found without this? Is defensive measure the holy grail?
Kahrl’s favorite books include Weaver on Strategy, The Numbers Game, and The Historical Baseball Abstract.
***
After Christina’s presentation I interviewed S. L. Price about his book on Mike Coobaugh, HEART OF THE GAME, and missed Vince Gennaro’s presentation, but hopefully I can get the gist from him at dinner tonight. (Later: damn, sat too far from Vince to catch up with him.)
***
Trends in Bullpen Development
Mike Emeigh
Late Inning Trends — showing that “closers” (primary pitcher who pitched in late inning lead situations, difficult to say with bad teams who didn’t have many late inning leads, and a few who split up the duties). Showing a graph that demonstrated the closers were getting 35% of the 9th inning situations in 1960, and now they are getting about 65% of the “high leverage” situations in the 9th.
In 1960 across the board, closers would come in late in the game, much more often when the team had a lead than other pitchers would. CLear distinction between the use of top relievers and the rest.
Between 1960-1975, no real change in usage patterns.
In 1976 things started to change.
Between 1976 and 1990, closers started to be used much more at the beginning of an inning than in the middle and much more while in lead, and less when the game was tied. Entry before the 7th inning had been rare before, but now dropped to almost zero by 1990. In fact, ALL relievers started coming in less and less before 7th inning.
In 1984, the first major turning point in closer usage. You start to see the setup role starting to be defined. Some former closers went into that role (Lopez, Detroit; Lucas, San Diego; Garber, Atlanta). Often they would sign a closer and then move their previous closer into the setup role. Also lefthanded closers nearly always had a righthanded setup man.
1988 is often cited as the first year of the modern closer. Mike looked at top closer usage patterns that year. Eckersley often cited as the model, but nearly all top closers in 1988 had same usage pattern as he did. They had no true setup reliever at the time, but Honeycutt was pitching as a LOOGY.
From 1991-2001, there’s even less and less and less of closers coming in partway through an inning. Other relievers ALSO doing so. Other relievers start to do more pitching with a lead. Tom Henke of Toronto and Olsen of Baltimore were the true first one-inning closers. Johnny Oates took over Baltimore and made him a one-inning closer, and then he used Lee Smith that way, and then brought the idea to Texas. The 7/8/9 pattern became established in the mid2000s. Current patterns of usage have been mare or less stable since 1990.
LOOGY usage peaked in mid-90s, has been declining ever since.
(LOOGY, for those who need to know, is defined as Lefthanded One-Out Guy).
* * *
Does Base Running Harm Pitching Performance?
Dave Smith
Dave loves to explore the truisms used by tv announcers, like “good teams win close games,” which he debunked a few years back. The latest one of these is that offensive activity by a pitcher tires him out, and hurts his performance, and even coming out on deck might hurt the tender psyche of the AL pitcher who isn’t used to it. Some even go so far as to say offensive innings by their own team (long delays) will
99.2% of all games from 1962 through present are in Retrosheet. That’s a lot of data.
Seeking meaningful comparisons. Looking at the inning immediately following pitching, versus the inning did pitch. Also looked at the era in which played, and also which inning it was, early/late, etc.
Era: pre-DH vs DH
AL vs NL since DH
Interleague — AL vs NL pitchers in NL parks
Only looked at starters.
1,365,498 innings total, only 309,896 are after batting.
ERA after batting is 3.85, not batted is 4.13.
What?? You mean that pitchers after batting is actually better? Yes!!
Now looking at eras:
1952-1972, the ERA and OPS is basically identical whether they batted or not.
1973 – 2009… now we’re looking at 3.98 vs 4.27 ERA, and OPS .723 goes to .741
The pitcher who is supposed to be disadvantaged by it is still doing better.
Now let’s look at National League parks only: it flattens out somewhat, but what effect is there still goes “the wrong way.” 4.38 vs 4.43.
Now let’s break it down into AL pitchers and NL pitchers in NL parks:
NL pitchers go from 4.22 to 4.37 in ERA, while the AL pitchers suddenly finally show the “expected” effect of worsened ERA, but it’s a very small one and the sample size is only 3000 innings.
So let’s look at whether he reaches base or not. Now the innings totals is really too small to be significant. We can break it down even smaller, like does he score? Get left on base? Get thrown out? The results can’t possibly be meaningful since they show that they really aren’t good after scoring, but do really well after getting thrown out.
No other factors came out to mean anything. Game score, how the pitchers did earlier, strikeouts, etc. Dave looked at just about every possible factor and still nearly every time the pitchers threw BETTER after they pitched.
The plural of “anecdote” is not “data.” No matter how many times you tell a story, it doesn’t aggregate into data.
SO, does running the bases harm pitching performance? Very definitely NO.
* * *
Effect of Defensive Position on Offensive Performance< .b>
presented by Pat Kilgo
McCarver said things like “Catchers have poor at bats as the game goes on because their hands get sore.” and today in the All Star Game he talked about the 3rd 4th and 5th at bats as “throw away at bats.”
These researchers, Kilgo and four collaborators, delved into whether position fatigue exists and whether the physically taxing position creates fatigue in the later innings.
They went to Retrosheet from games from 2004 – 2008. Looked into OBP, hits, drawing a walk, in all plate appearances. Didn’t count pitchers, and didn’t count players who changed positions, and didn’t count extra innings. And excluded beyond 52 team plate appearances.
First graph shows for team plate appearances on base percentage does decline a bit in late innings. BUT… is fatigue what causes it? Pitching changes, season length, player age, handedness matchups?
The researchers corrected for these potential factors in various ways that I won’t detail here.
First looking at Unadjusted OBP: As it turns out, the DH has no drop off at all throughout game. The Catcher does drop off in late innings but not nearly as sharply as some positions.
Now homers: How funny that the catcher when it comes to home runs is the one that doesn’t drop off in the later innings much. Catches also have the least decline in unadjusted hits. They have the flattest dives of all the players.
Now to look at them adjusted for confounding factors.
OBP: all except the DH show the same effect, a slight rise then a drop off toward end of the game.
HR: Again, catcher stays consistent throughout the game, while everyone else declines.
Hits: The Catcher stays pretty much the same throughout game.
BB: Infielders tend to get more walks as the game progresses. But the catcher actual declines in walks as game goes on. This may be because catchers tend to be their team’s number eight or nine hitters and are never pitched around in the late innings.
Conclusion: Tim McCarver is mostly wrong. We have no evidence of disproportionate decline of catchers versus other players.
Even after adjustment for other confounding factors, an unexplained decline in offensive performance generally persists for all positions. At least a portion of this decline may be attributed to fatigue, but this fatigue is not worse for catchers than other players.
***
After the last research presentation of the day, I went to check out the poster presentations. There are so many of them this year! I only made it through half of the 18 posters (during the designated hour when the presenters were there to answer questions) before I realized I was already late to catch a group of women from the women in baseball committee who were going out together. I caught up to them at Chef Geoff’s and had a drink while we went around the table telling our stories, and before I knew it an hour had gone by, making me late to my actual dinner invitation with the baseball writers and editors from the Baseball Early Bird. (Foodie aside: I had a nice Belgian Trappist beer, the Chimay red, and just a sip of a wine I must try more of, a Syrah from Sicily called Nero D’Avola. Seriously complex wine–and probably even more fantastic with food. Now that I think about it, that might be one of the wines I tasted at a fancy wine tasting I went to over the winter. Hmm.) Fortunately the two restaurants were only a block apart and a ran to catch up with them in time to put in an order for a lovely lasagna and share a nice bottle of an almost sparkling southern Italian white very similar to some of the French whites that have very much the effect of sparkling mineral water, only without actual champagne-like bubbles. Very yummy and the conversation was stimulating.
Now I’m back in the hotel to post this before anything else drags me away! Tomorrow, more research presentations and then at 4pm on the bus to Baltimore for the ballgame. I don’t know how much I’ll be able to get posted before the Orioles game we’ll be busing to Camden Yards to see, but I shall try.

Post a Comment